
Tell us about the job
Takes about a minute. No obligation.

A contractor quoting a mini-split installation in Huntington County has to size for what the system will actually face, not for average conditions. 144 severe weather events were recorded in Huntington County, Indiana between 2015 and 2024. At that rate, severe weather is part of the normal operating environment, not an occasional outlier, and it shapes where outdoor units get placed, how refrigerant lines get run, and what mounting hardware gets spec'd. A system installed without that context is likely undersized or poorly positioned for the load it will carry from its first season.
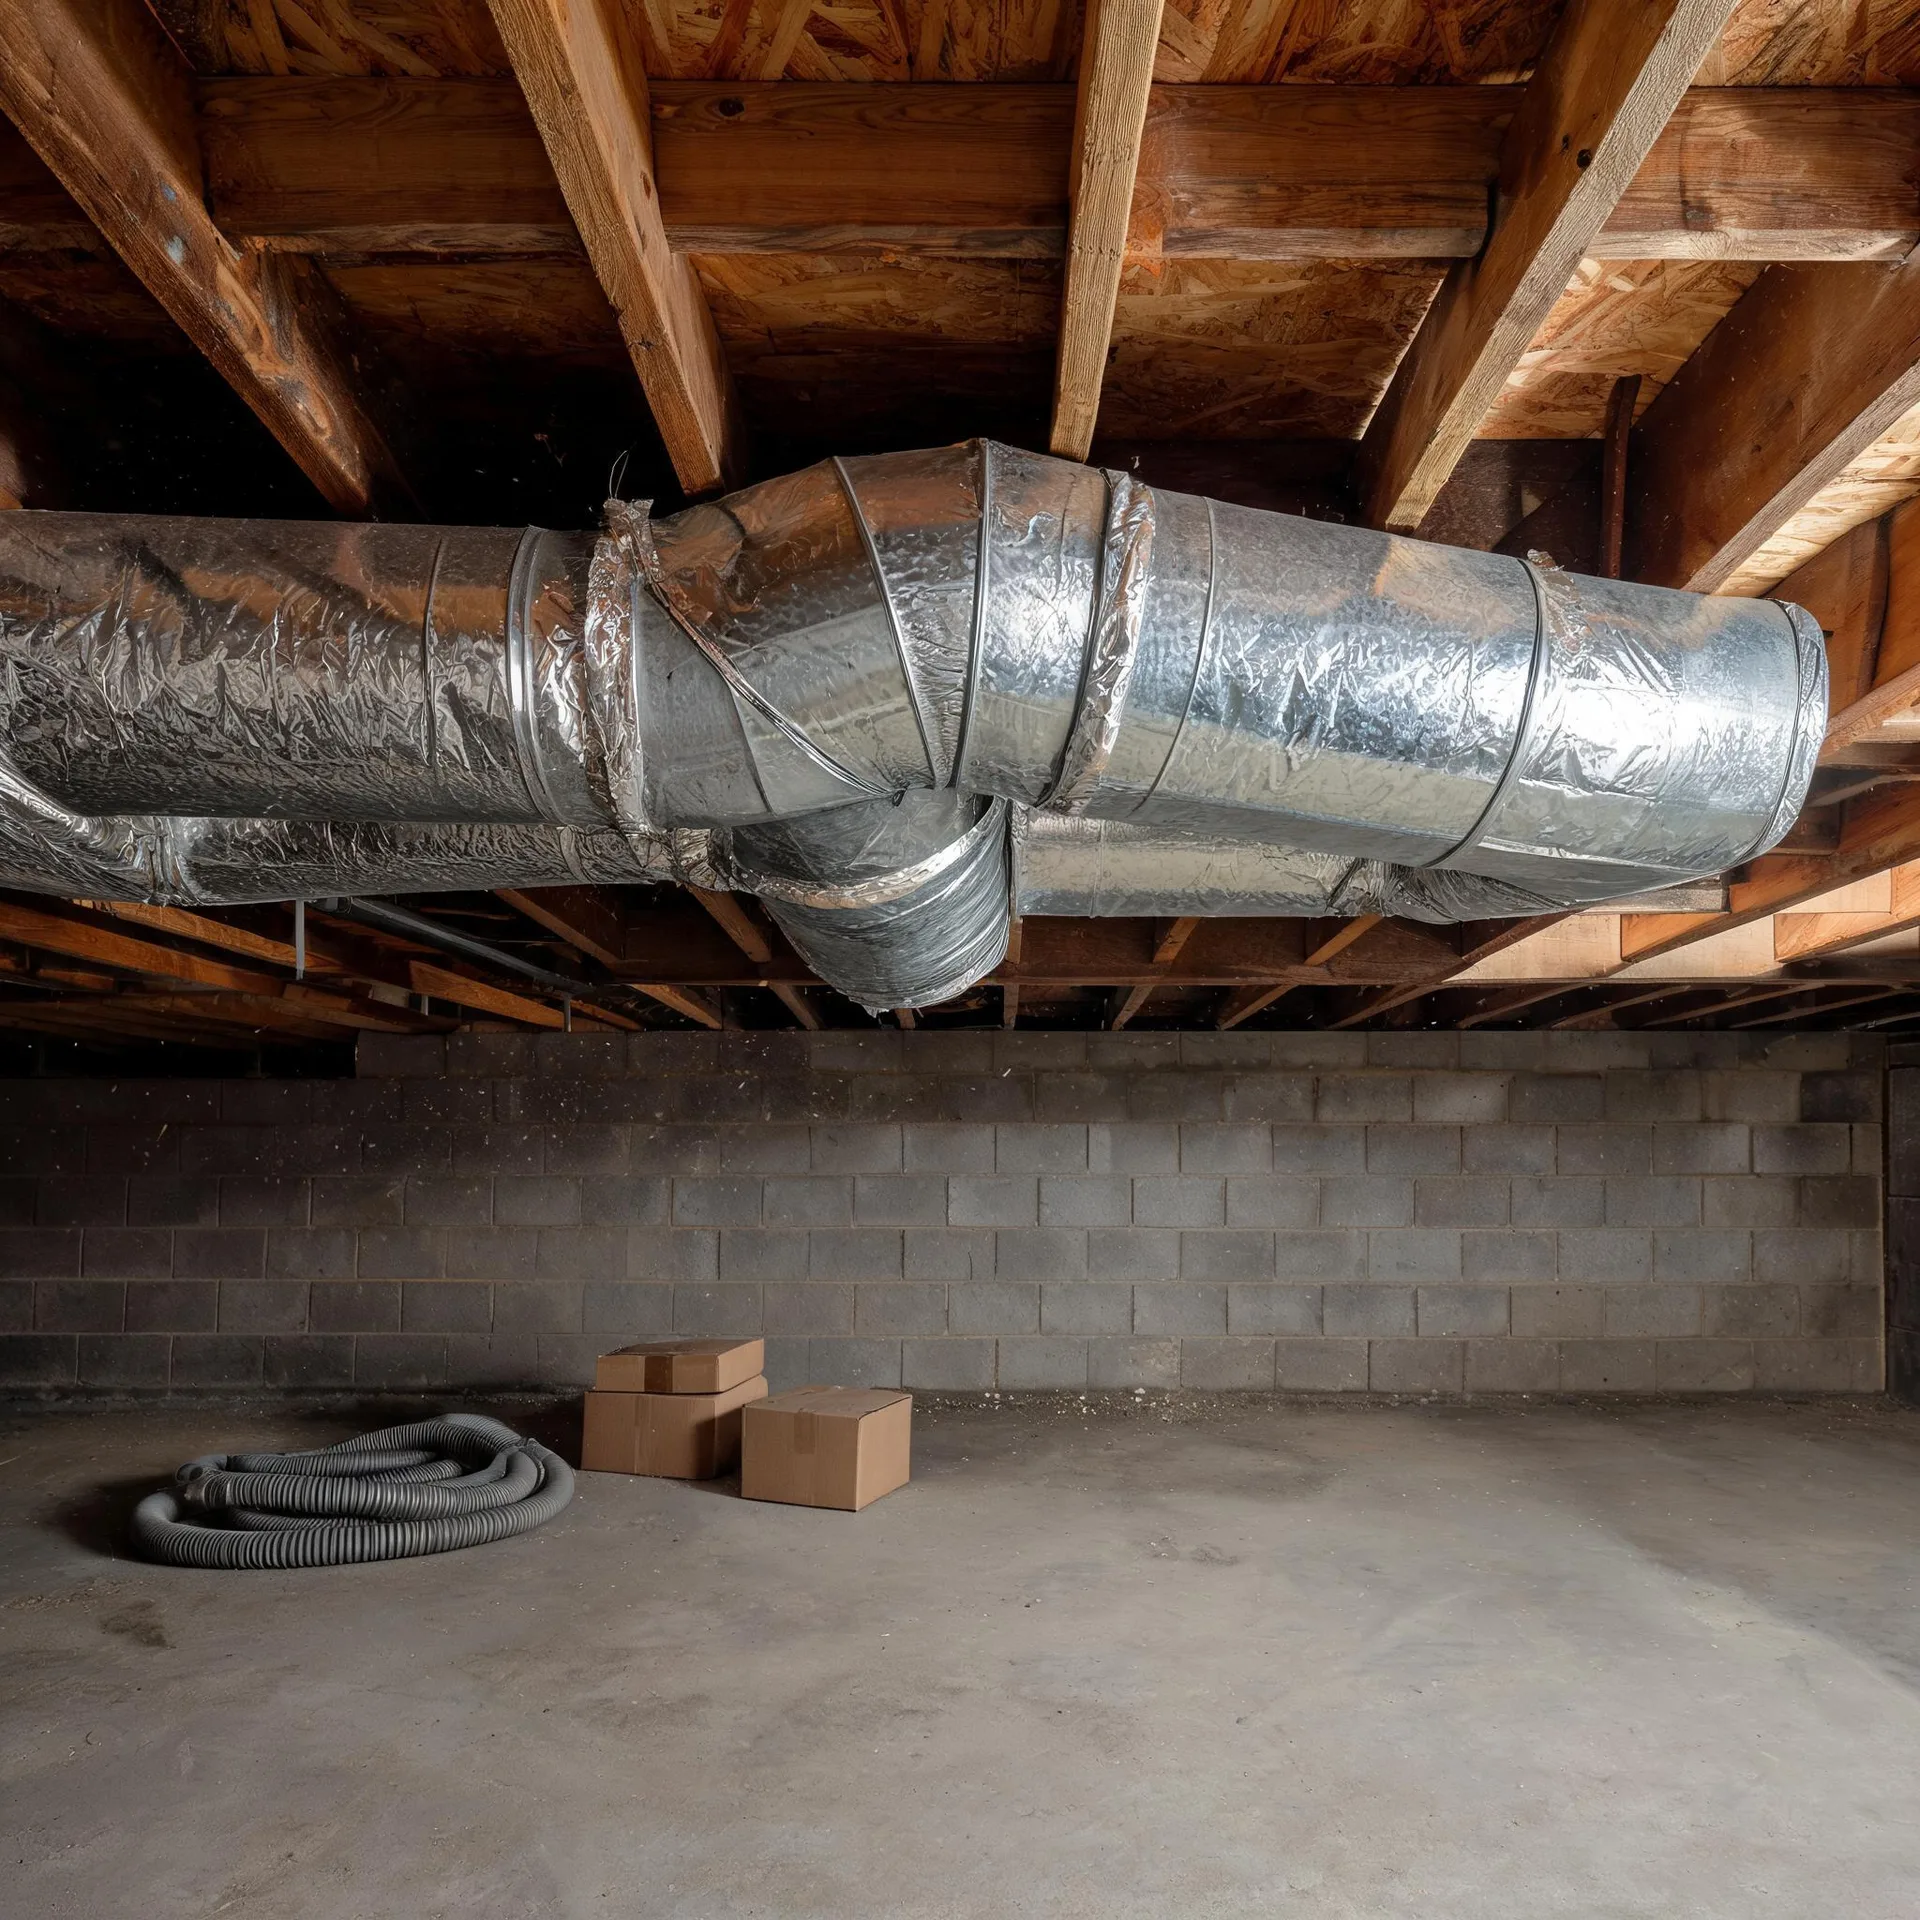
The electrical panel in a house built to mid-century code was sized for the loads of that era, and a mini-split draws differently than what those circuits were designed around. Half the homes in Huntington County, Indiana were built in 1966 or earlier (2020-2024 ACS 5-year). A contractor quoting an installation here will open the panel box early, because the service capacity determines what a new unit can actually run on without a separate upgrade. Ductwork is a separate question for a ducted system, but with a mini-split the wiring path and the panel are what the job turns on.
The Parts of a Mini-Split System and What Gets Installed

The indoor air handler mounts high on an interior wall inside the room being conditioned. It is the piece a homeowner sees every day. The outdoor condenser unit sits on the ground or a bracket outside the house and houses the compressor and the components that drive the whole system.
A set of refrigerant lines runs through a small opening in the wall and connects the indoor unit to the outdoor unit. A condensate drain line runs alongside them, carrying moisture out of the indoor unit. A dedicated electrical line feeds the outdoor unit from the panel.
The drawing shows how these pieces relate in a typical installation, and a licensed contractor determines exactly how they are placed and routed in your home.
Find a contractor in Huntington CountyHuntington County, by the numbers
144 severe weather events were recorded in Huntington County, Indiana between 2015 and 2024.
NOAA National Centers for Environmental Information, Storm Events Database, bulk CSV export, events 2015-01-01 through 2024-12-31.Half the homes in Huntington County, Indiana were built in 1966 or earlier (2020-2024 ACS 5-year).
U.S. Census Bureau, 2020-2024 American Community Survey 5-Year EstimatesHuntington County, Indiana holds 16,340 housing units (2020-2024 ACS 5-year).
U.S. Census Bureau, 2020-2024 American Community Survey 5-Year EstimatesOwners occupy 77.4% of the occupied homes in Huntington County, Indiana (2020-2024 ACS 5-year).
U.S. Census Bureau, 2020-2024 American Community Survey 5-Year EstimatesSevere Weather Events in Huntington County
Local weather puts real demands on heating and cooling equipment, and those demands vary by where you live. A mini-split sized and installed for what Huntington County actually experiences will hold up differently than one specified without that context.
144 severe weather events, 2015–2024. Source: NOAA National Centers for Environmental Information, Storm Events Database.