Tell us about the job
Takes about a minute. No obligation.
A contractor sizing a mini-split in Scott County starts with the building: its exposure, its insulation, and how the rooms actually hold or shed heat. 45 severe weather events were recorded in Scott County, Indiana between 2015 and 2024. At that rate, severe weather is a real but infrequent presence, and a system that underperforms after installation almost always traces back to how it was sized and set up, not to what the sky has done to it. A rushed load calculation or a poorly placed head unit will cost a homeowner far more than the weather record here can account for.
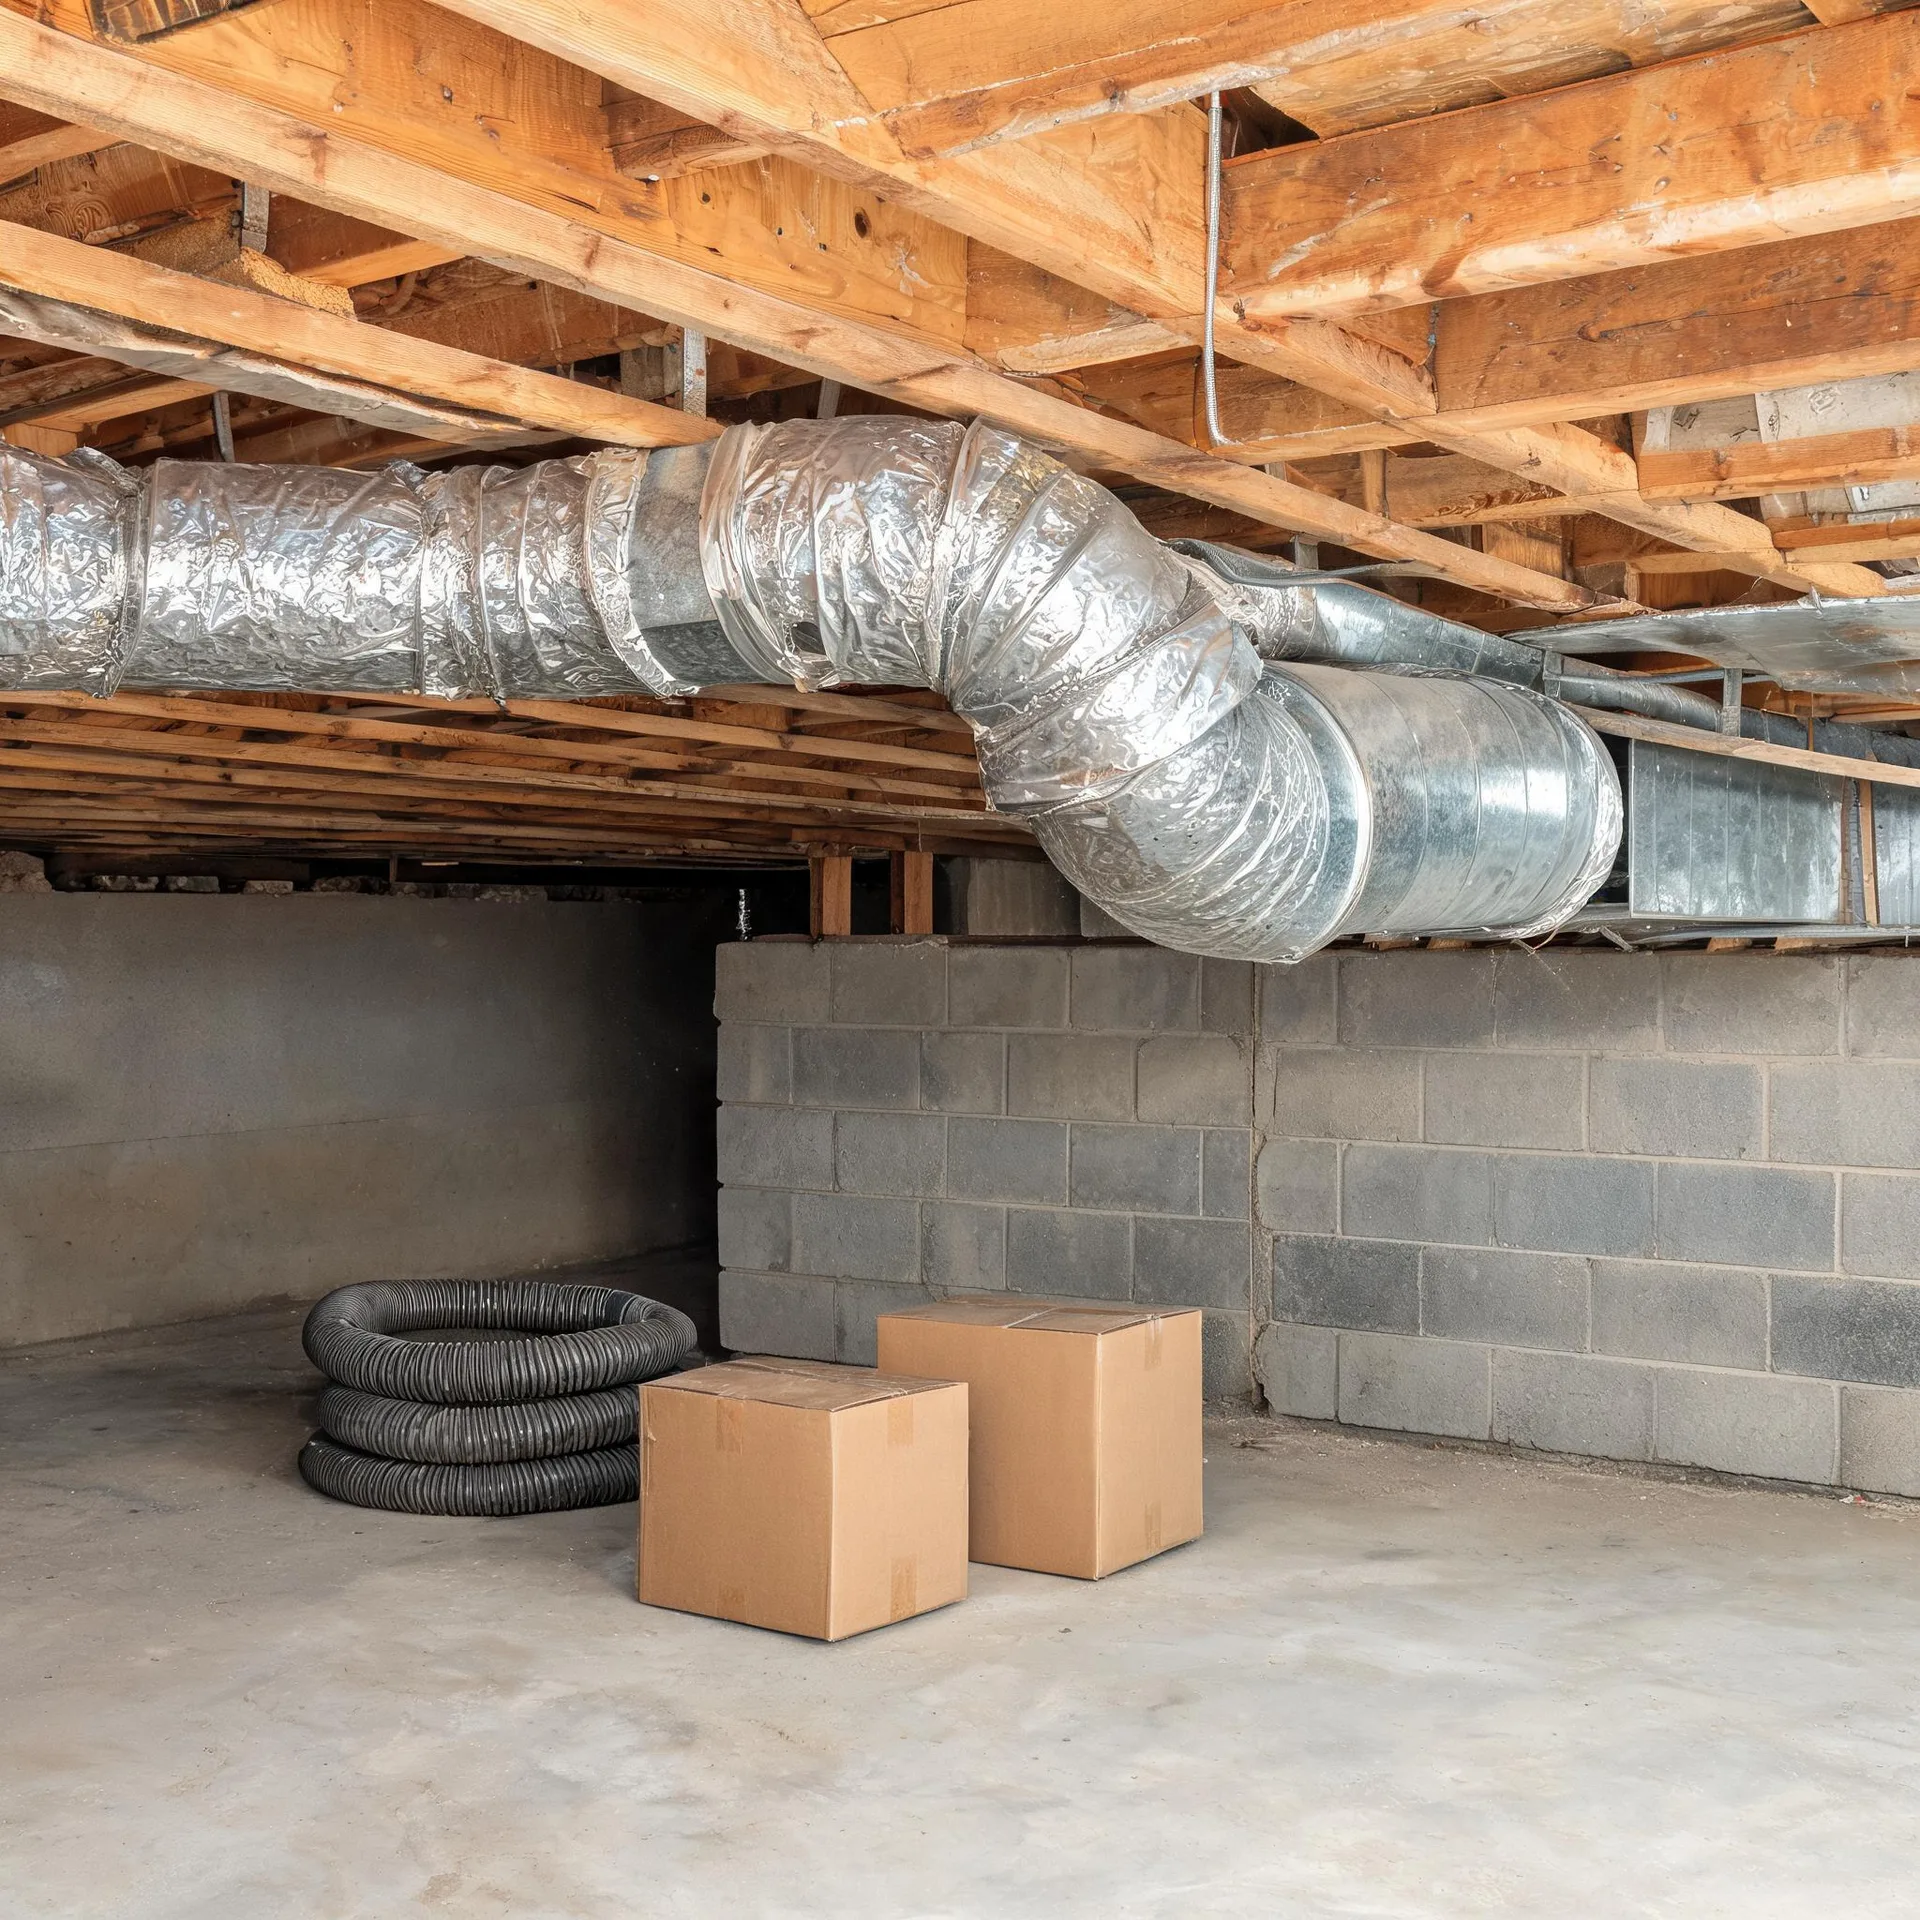
The electrical panel in a Scott County house is often the first thing a contractor prices, before the unit, before the line set, before the mounting location. Half the homes in Scott County, Indiana were built in 1983 or earlier (2020-2024 ACS 5-year). Wiring put in for the appliances and heating of that era was not sized around the draw of modern mini-split equipment, and the gap between what a panel supplies and what a new system requires is where installation budgets shift. A contractor who quotes the indoor and outdoor units first and checks the electrical second will sometimes have to revise that quote once they open the panel.
The Parts of a Mini-Split System and What Gets Installed
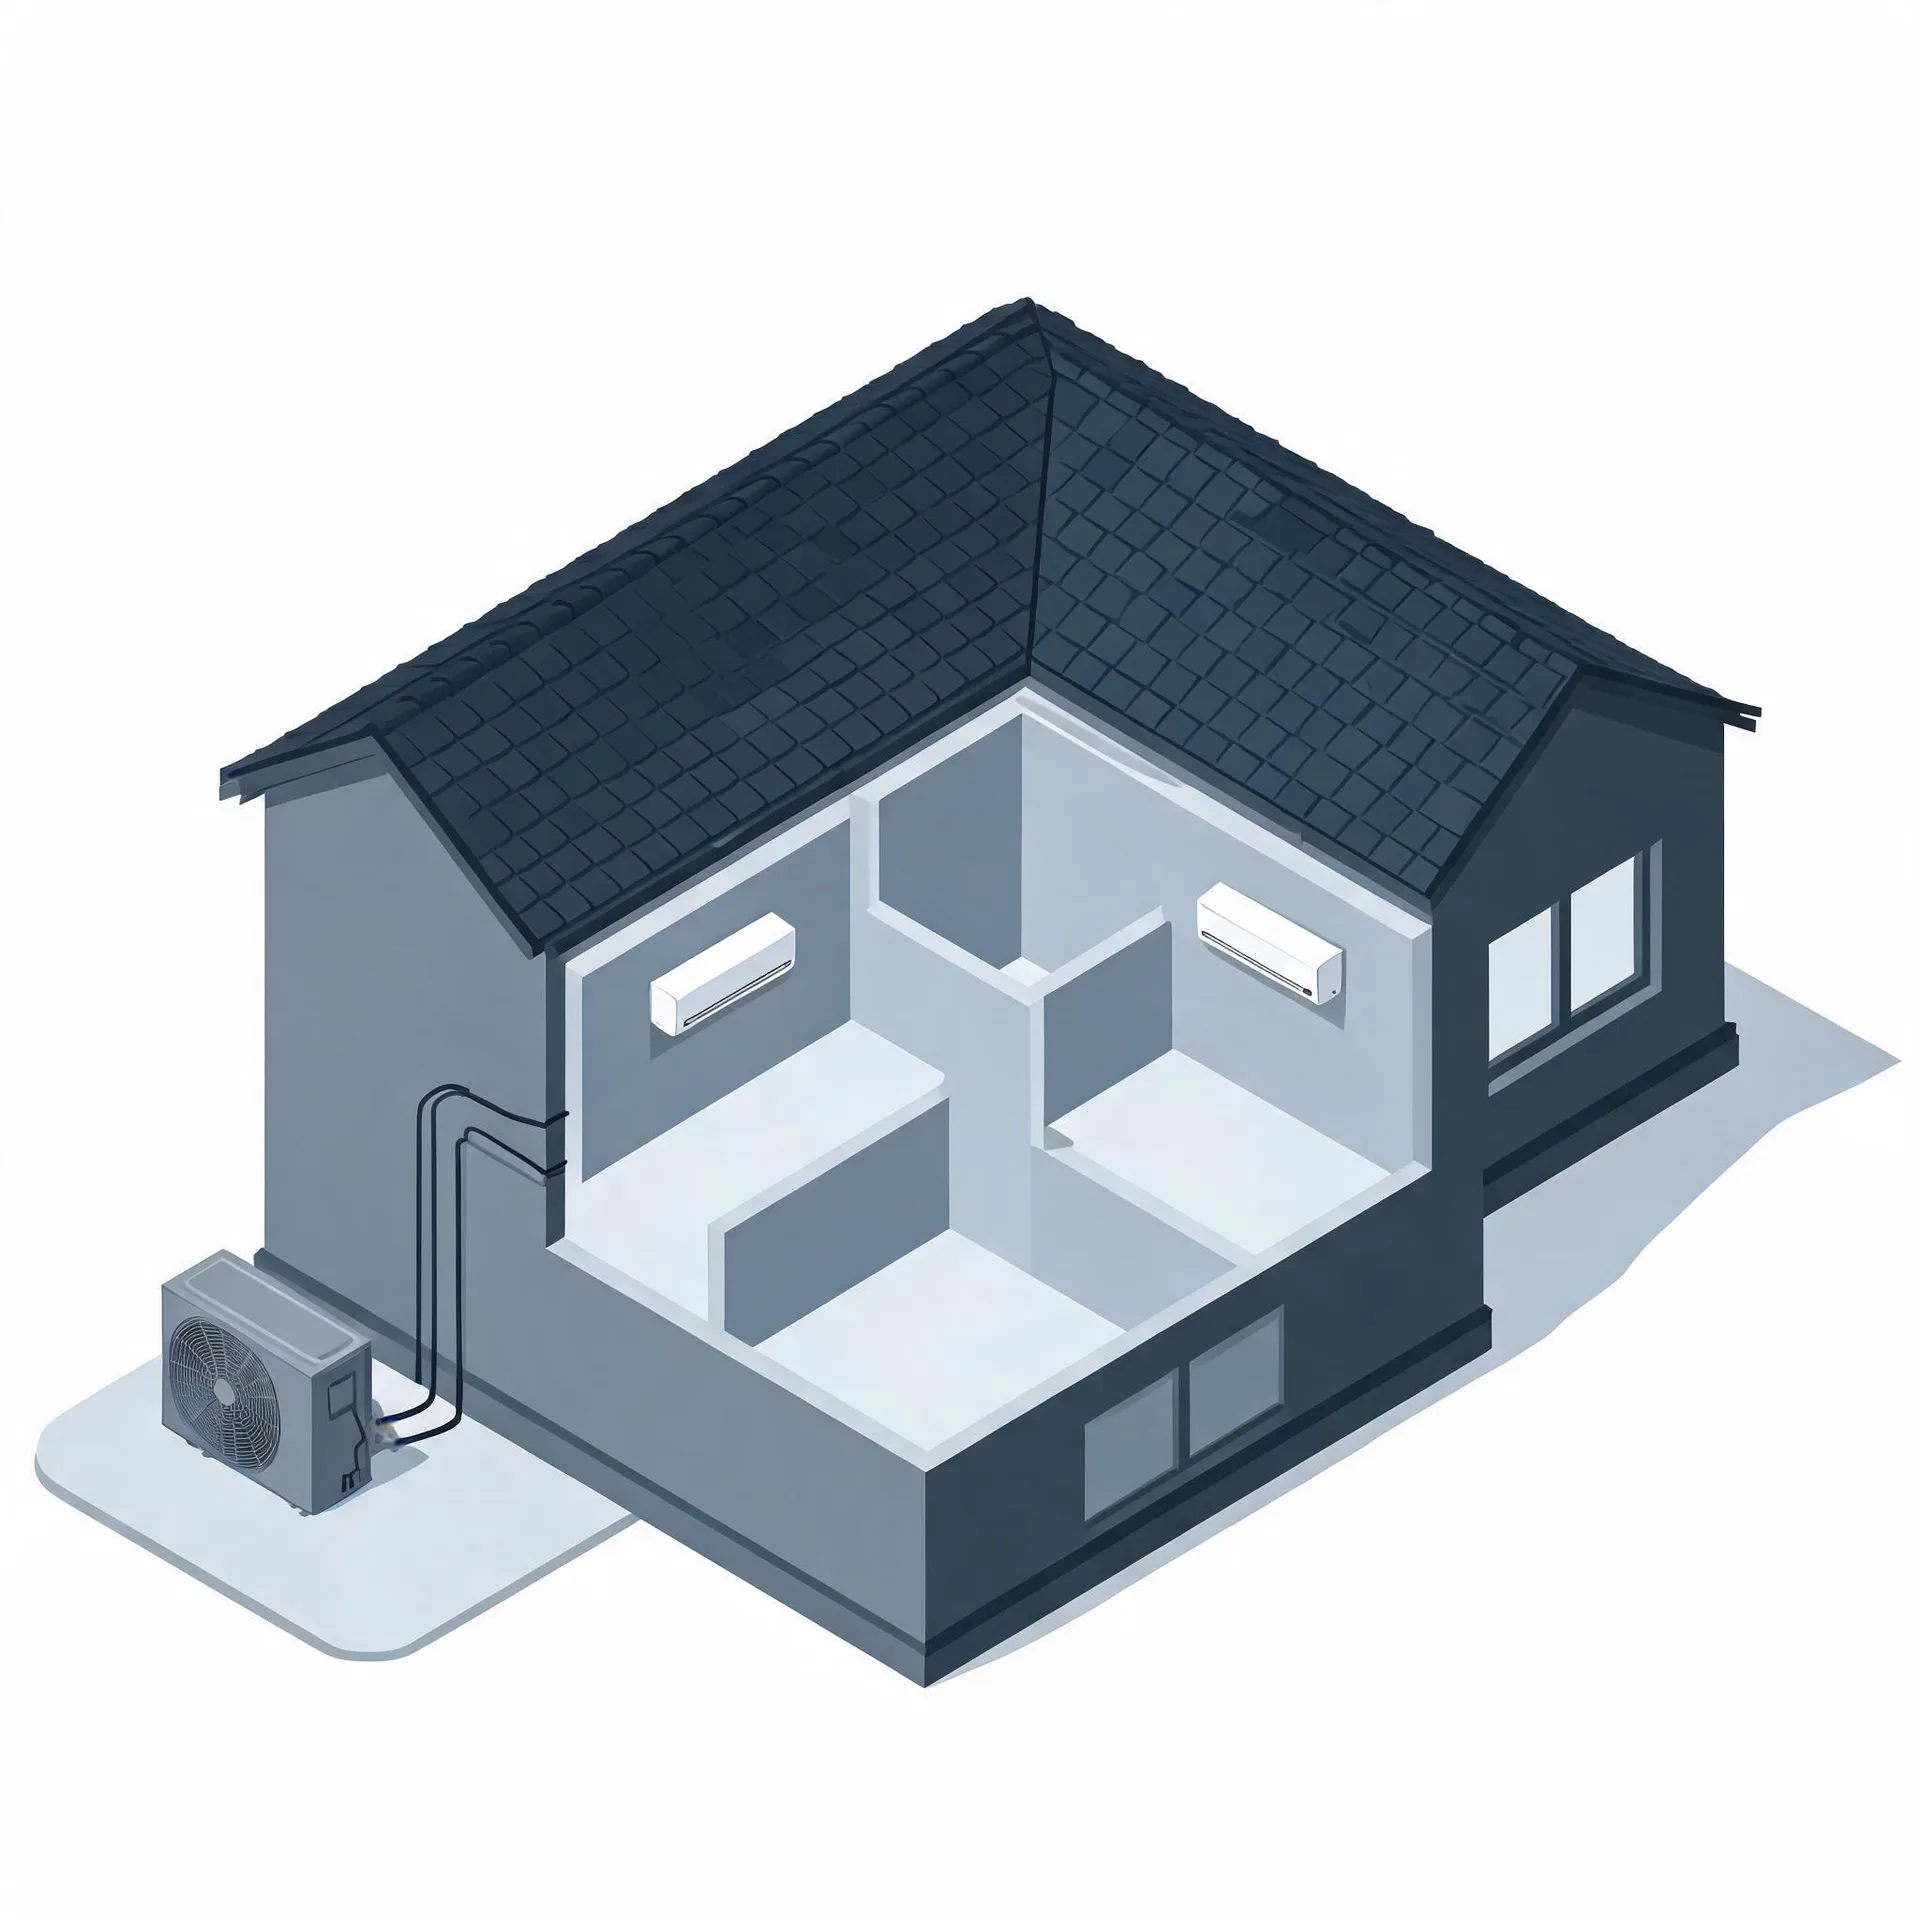
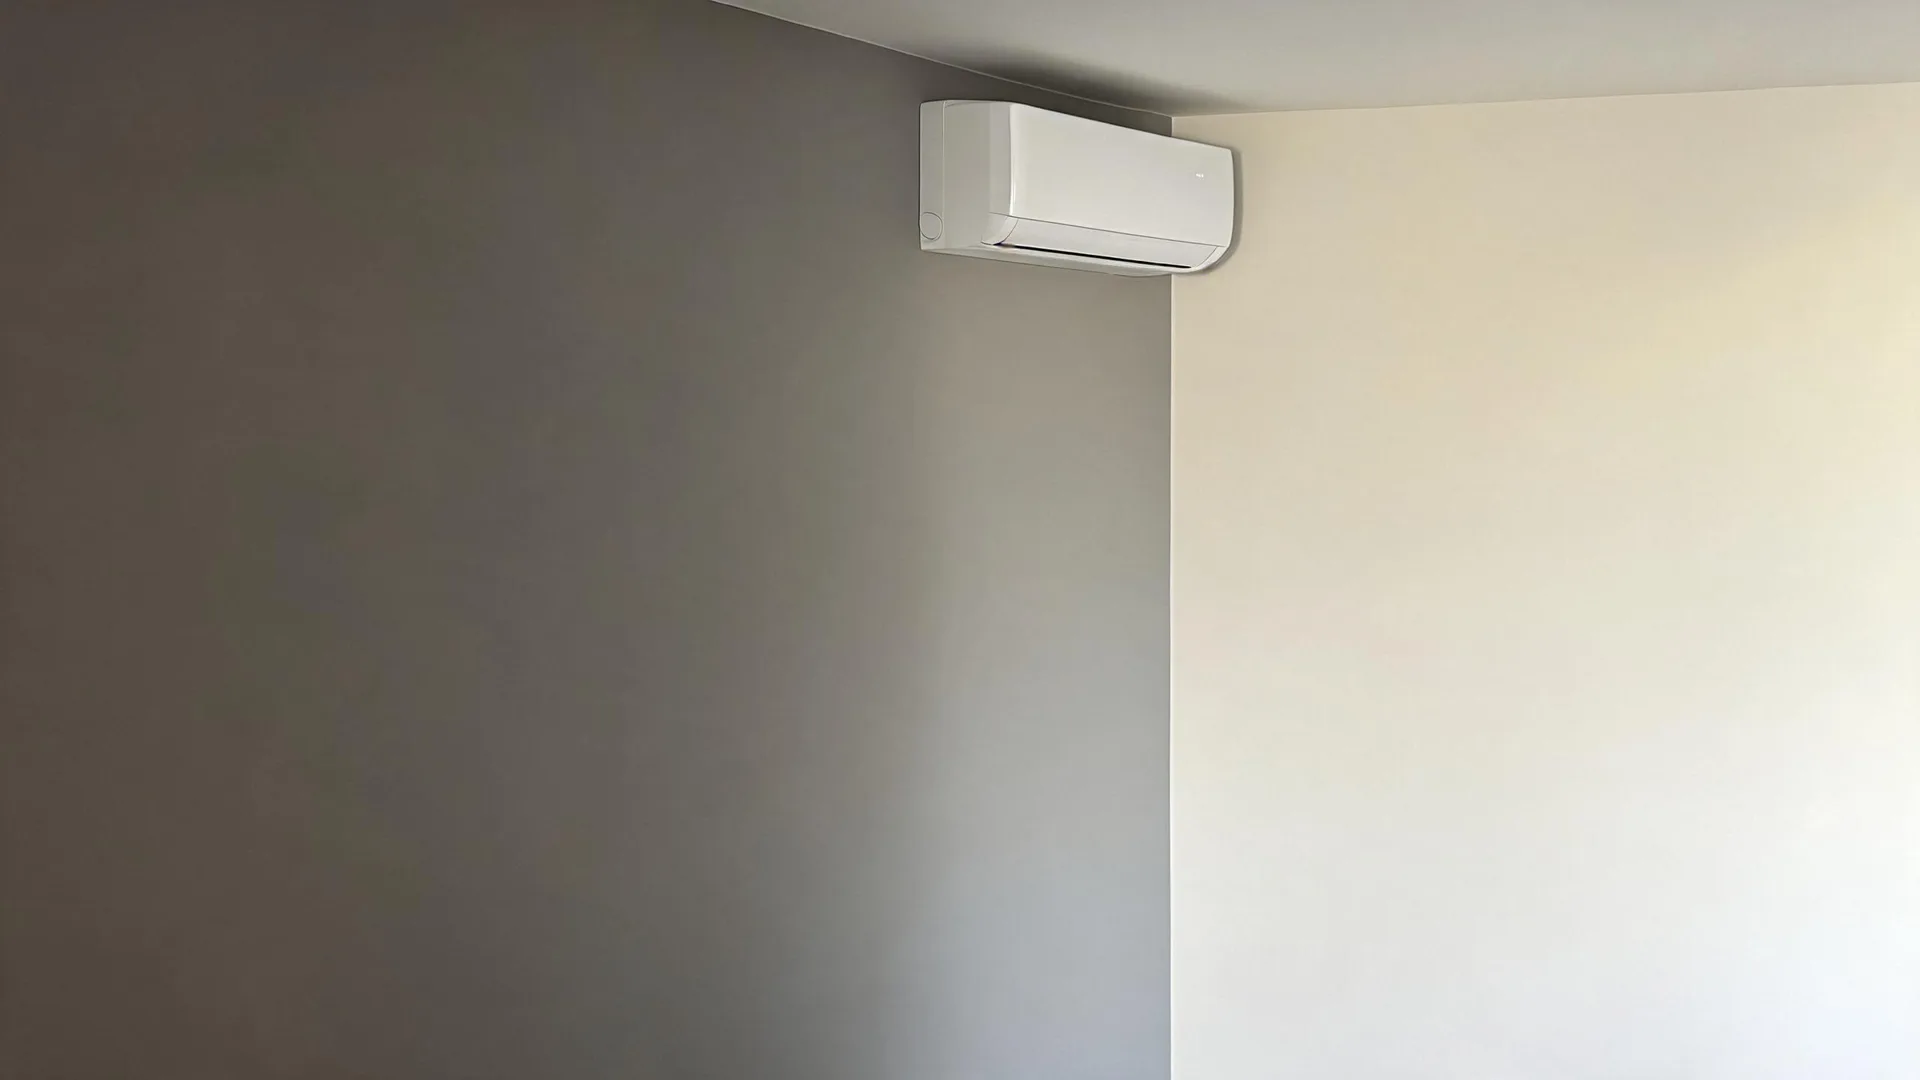
The indoor air handler mounts high on an interior wall inside the room being served, and it is the piece a homeowner sees every day. The outdoor condenser unit sits on a pad or brackets outside the house and contains the compressor and fan that drive the whole system.
A refrigerant line set runs through a small hole in the wall to connect the two units, and a condensate drain line carries moisture from the indoor unit to the outside. A dedicated electrical disconnect is mounted near the outdoor unit to give a contractor safe access to cut power when needed.
The drawing shows a typical layout, and a licensed contractor determines exactly how each piece is positioned and routed in your home.
Find a contractor in Scott CountyScott County, Indiana, by the numbers
45 severe weather events were recorded in Scott County, Indiana between 2015 and 2024.
NOAA National Centers for Environmental Information, Storm Events Database, bulk CSV export, events 2015-01-01 through 2024-12-31.Half the homes in Scott County, Indiana were built in 1983 or earlier (2020-2024 ACS 5-year).
U.S. Census Bureau, 2020-2024 American Community Survey 5-Year EstimatesScott County, Indiana holds 10,840 housing units (2020-2024 ACS 5-year).
U.S. Census Bureau, 2020-2024 American Community Survey 5-Year EstimatesOwners occupy 70.9% of the occupied homes in Scott County, Indiana (2020-2024 ACS 5-year).
U.S. Census Bureau, 2020-2024 American Community Survey 5-Year EstimatesSevere Weather Events in Scott County
Scott County's climate puts real demands on heating and cooling equipment year over year. A mini-split sized and installed for local conditions holds up better than one specified for somewhere else.
45 severe weather events, 2015–2024. Source: NOAA National Centers for Environmental Information, Storm Events Database.